Using patented macroeconomic information provided by MacroRisk Analytics, we will discuss the economic outlook for Tyson Foods Inc. mentioned in our “Stocks with Highest and Lowest Return-to-risk Ratios Year-to-date” blog post on June 12, 2019.
In our previous post, we have identified Tyson Foods Inc. (ticker: TSN) as having the highest return-to-risk ratio out of the S&P 500 stocks from 12/31/18 through 6/10/19. The company’s economic profile as of 6/14/19 as demonstrated in the MacroRisk Report by MacroRisk Analytics is:
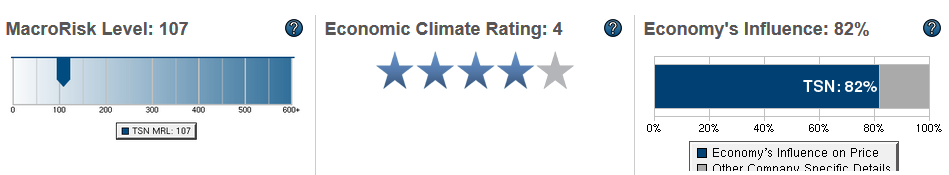
MacroRisk Level
The MacroRisk Level (MRL) measures an asset’s sensitivity to economic change (i.e. another measure of an asset’s risk). Tyson Foods’ MRL is 107. Is this number too high, too low? To answer this question, let’s compare Tyson’s MRL to other companies in the consumer staples sector. Using MacroRisk Analytics, we uploaded the consumer staples holdings referencing the XLP holdings (SPDR ETF for consumer staples) as of 6/14/19 into a buylist. Next, we used the FiveRisks+ Holdings Table by MacroRisk Analytics to analyze the sector’s holdings versus Tyson Foods.

| Name | Symbol | MRL |
| Archer-Daniels-Midland Co | ADM | 87 |
| Coca-Cola Co (The) | KO | 103 |
| Sysco Corp | SYY | 103 |
| Tyson Foods Inc | TSN | 107 |
| Campbell Soup Co | CPB | 111 |
| Colgate-Palmolive Co | CL | 119 |
| Monster Beverage Corp | MNST | 130 |
| Mondelez International Inc | MDLZ | 140 |
| Brown Forman Corp | BF.B | 141 |
| Kimberly-Clark Corp | KMB | 141 |
As of 6/14/2019, there were 33 holdings in the consumer staples sector. The tables above show only a few of the holdings within the SPDR Consumer Staples ETF. The tables are sorted by the MRL from lowest to highest. Tyson Foods is similar to Sysco Corp and Campbell Soup in its sensitivity to changes in the economy. Among the 33 holdings in the consumer staples sector, the lowest MRL in 87 (Archer-Daniels-Midland) and the highest is 292 (Walgreens Boots Alliance). As a reminder, the MRL for Tyson Foods is 107. Within the consumer staples sector, Tyson Foods’ MRL percentile rank is 10%. In other words, 10% of companies in the consumer staples have a lower MRL and 90% have a higher MRL (i.e., 90% of the consumer staples sector holdings have higher risk as measured by their stock price response to the economy).
Economic Climate Rating
The Economic Climate Rating (ECR) measures how favorable the current economic climate could be for an asset (i.e., a stock) over the next 6 to 12 months. It is a 5-star scale: 1 being the worst, 5 being the best. Tyson Foods’ ECR is a 4 meaning that the current economy could be considered favorable for the company. Exporting the FiveRisks report by MacroRisk Analytics to an Excel spreadsheet, we can summarize the ECRs as follows:
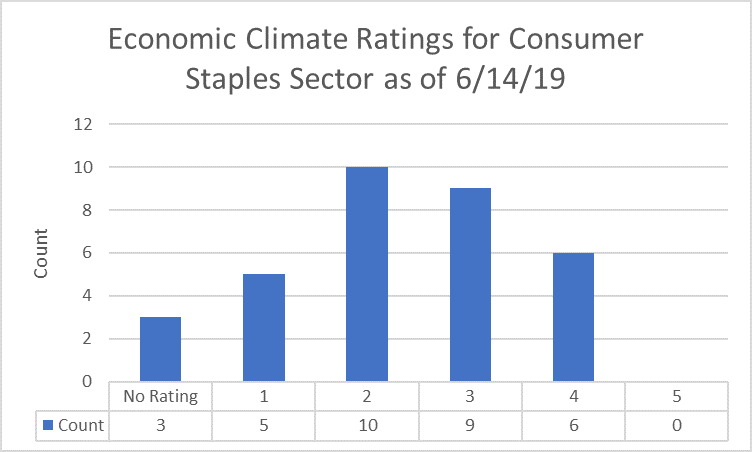
The distribution of the ratings is positively skewed meaning that there are more companies in the consumer staples sector with ratings below 3. This may indicate that currently, the economy is expected to be neutral or not favorable to the majority of companies in that sector.
Economy’s Influence
The Economy’s Influence shows how much of an asset’s price and value movement is explained by changes in the economy. Our model indicates 82% of Tyson Foods’ stock price is explained by changes in the economy, and we attribute the other 18% to company-specific information. This is a relatively low number because the average portion of the stock price movement that is explained by the economy in the consumer staples sector as of 6/14/19 is approximately 88%. Our model indicates that about 20% of the companies (i.e., their stock prices) in the sector are less influenced by the economy and about 80% of the companies (i.e., their stock prices) are more influenced by the economy.
Eta® Profile
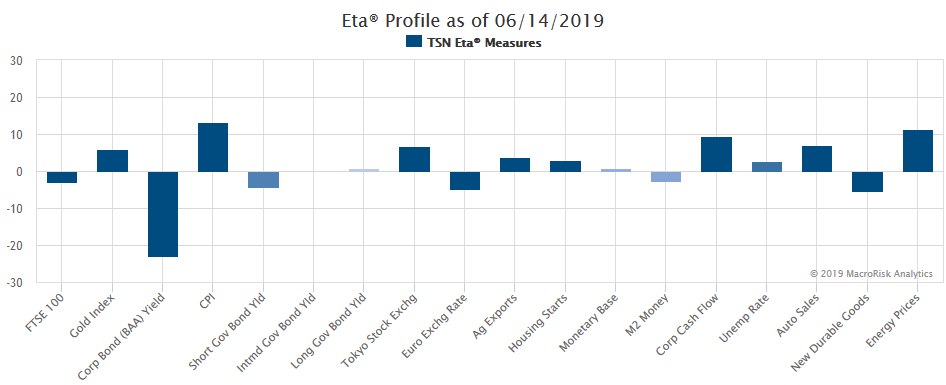
Finally, we would like to show another patented, proprietary economic analysis for Tyson Foods. And, it is the Eta® profile or what we call the “DNA” of the company. If you are a new reader and would like to learn how to understand the Eta® profile, click here. Here’s the Eta® profile for Tyson Foods:
Currently, the company’s top 3 sensitivities are to:
- corporate bond (BAA) yield
- CPI (inflation)
- energy prices
Tyson’s stock price is negatively influenced by the BAA yield meaning that if the BAA yield were to decrease, this would be expected to benefit the stock’s price and vice versa. On the other hand, it is positively influenced by the CPI and energy prices meaning that if these two factors were to increase, this would be expected to benefit the stock’s price and vice versa.
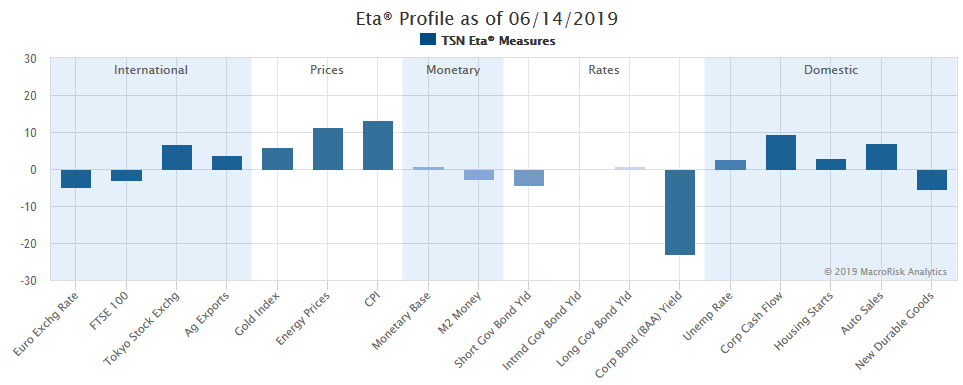
Here’s a variation of the Eta® profile where the current economic status is also presented:
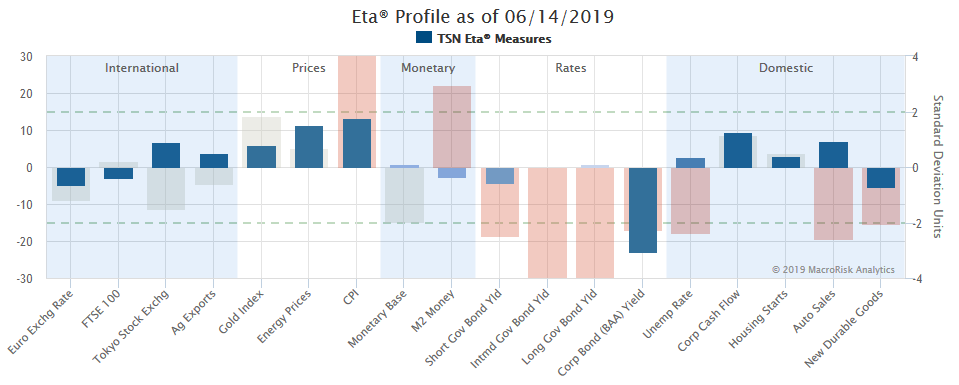
It can be seen that the BAA yield has actually decreased (see the direction of the non-blue bar for the BAA yield factor in the chart above), and the CPI and energy prices have increased relative to their recent levels.
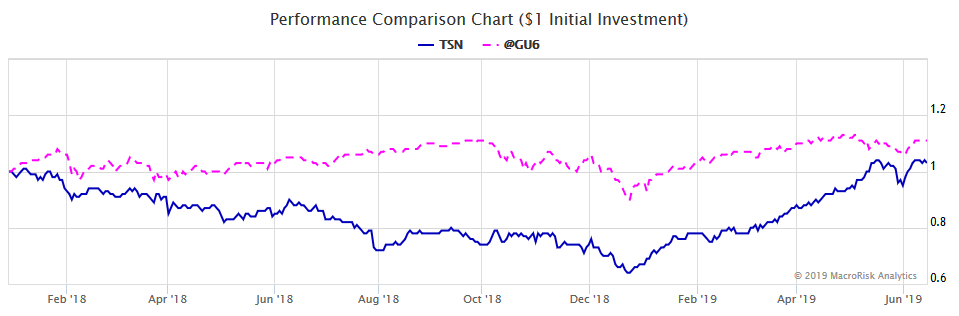
Here’s a graph of Tyson’s stock price versus the S&P 500 Total Return Index from 12/29/2017 through 6/14/2019:

MacroRisk Analytics has a selection of proprietary analysis tools that use macroeconomic variables to provide information on tens of thousands of stocks, mutual funds, exchange traded funds, and other traded assets. By using these tools to evaluate Tyson Foods (TSN), we believe that the company has lower overall economic risk, and a more favorable macroeconomic status compared to other companies in its sector. A more detailed examination shows that recent changes in the CPI and Corporate Bond Yields have particular impact. Click here to see how MacroRisk Analytics can help you.