Some common rules-of-thumb are that cyclical companies tend to be riskier because their returns swing higher or lower than those of non-cyclical companies and that the consumer staples sector tends to be less risky than the consumer discretionary sector. Such generalizations oversimplify the investment analysis of how economic shocks impact companies because, frankly, more detailed analysis can be hard and confusing. But, investors face complications, losses, and leaving money on the table, if economic risks aren’t better understood. Now, using the patented and proprietary tools available on the MacroRisk Analytics platform, we can measure the overall sensitivity to the economy found in individual assets and better understand which stocks are most, and least, sensitive to economic shocks.
For this analysis, we define economic risk exposure as an asset’s sensitivity to changes in the economy. The more sensitive a stock, mutual fund, or a portfolio is to changes in key economic variables, the more economic risk it has and vice versa. On its www.MacroRisk.com website, MacroRisk Analytics® calculates its MacroRisk Level, an aggregated measure across economic factors of each asset’s sensitivity to the economy.
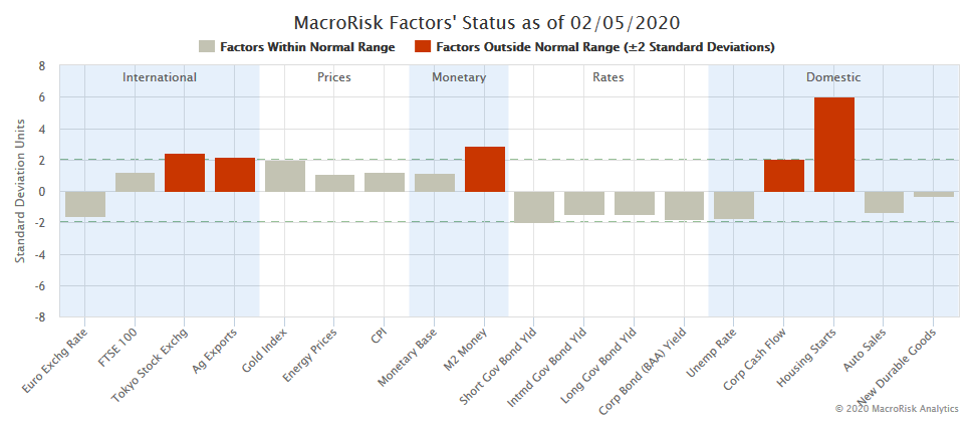
We measure “the economy” using 18 macroeconomic variables that the MacroRisk data analytics team identified as a robust set of factors that does a good job of explaining the movement of asset values over time. These 18 factors include interest rates, international variables, various price index levels, monetary variables, and domestic production variables. (The patented MacroRisk approach has been analyzed in multiple academic papers, with two papers winning the William F. Sharpe Indexing Achievement Award for the ETF/Indexing Paper of the Year in 2013 and 2015.) The MacroRisk Level provides an aggregate statistic across all 18 macroeconomic factors for seasoned companies, those with at least three years of trading history.
The 10 seasoned companies in the S&P 500 Index with the most amount of economic risk as of 2/10/2020 are:
| Rank | Name | Symbol | Sector | MacroRisk Level |
| 1 | Advanced Micro Devices Inc | AMD | Information Technology | 644 |
| 2 | Xilinx Inc | XLNX | Information Technology | 640 |
| 3 | Hollyfrontier Corp | HFC | Energy | 571 |
| 4 | Ulta Beauty Inc | ULTA | Consumer Discretionary | 484 |
| 5 | ABIOMED Inc | ABMD | Health Care | 483 |
| 6 | Paycom Software Inc | PAYC | Information Technology | 480 |
| 7 | Twitter Inc | TWTR | Communication | 472 |
| 8 | Macy’s Inc | M | Consumer Discretionary | 429 |
| 9 | Centurylink Inc | CTL | Communication | 414 |
| 10 | Coty Inc | COTY | Consumer Staples | 413 |
According to the common wisdom, one could have labeled Coty Inc. as a relatively less risky stock just because it’s in the consumer staples sector. However, taking a deeper look and understanding the economic risk exposure measured for this stock shows that it might not be such a safe company after all.
And, the 10 seasoned companies in the S&P 500 Index with the least amount of economic risk as of 2/10/2020 are:
| Rank | Name | Symbol | Sector | MacroRisk Level |
| 1 | Host Hotels & Resorts Inc | HST | Real Estate | 34 |
| 2 | Nucor Corp | NUE | Materials | 62 |
| 3 | Maxim Integrated Products Inc | MXIM | Information Technology | 64 |
| 4 | Fidelity National Information Services | FIS | Information Technology | 65 |
| 5 | Digital Realty Trust Inc | DLR | Real Estate | 67 |
| 6 | Loews Corp | L | Financials | 68 |
| 7 | FirstEnergy Corp | FE | Utilities | 69 |
| 8 | Blackrock Inc | BLK | Financials | 70 |
| 9 | Interpublic Group of Companies Inc (The) | IPG | Communication | 70 |
| 10 | Westar Energy Inc | EVRG | Utilities | 71 |
Similarly, just because Fidelity National Information Services is in the information technology sector does not make it a relatively riskier stock in terms of its low MacroRisk Level, or economic risk, of 65.
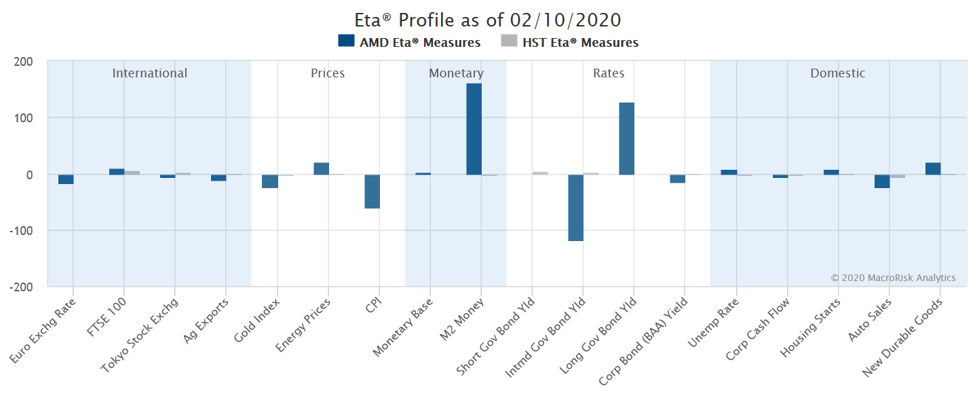
The MacroRisk Level is based on 18 individual factors and there may be value drilling down to see which economic variables are driving the MacroRisk Level. Using AMD, which had an estimate of 644 on 2/10/2020, we see that it is most sensitive to intermediate and long term bond yields and the M2 money supply (which reflects consumer credit).
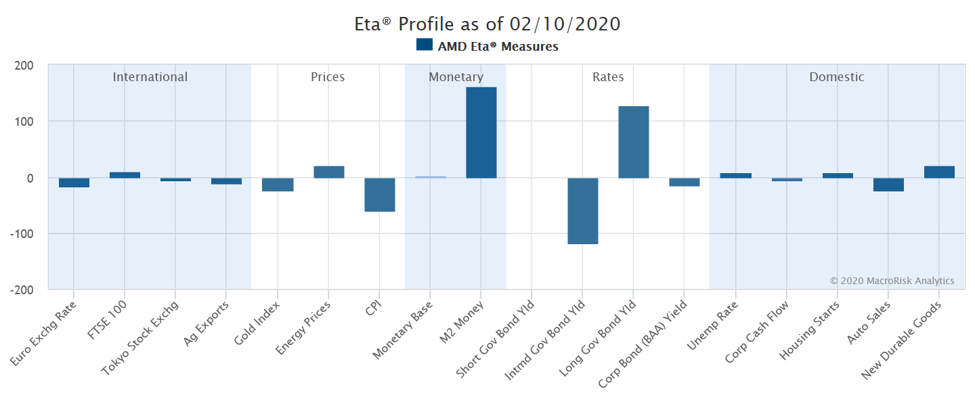
The graph above shows the economic risks which are used in
the calculation of the MacroRisk Level. The larger the bars, either positive or
negative, the riskier the company is expected to be. Notice the y-axis scale
which runs from -200 to 200.
Now, consider the specific economic sensitivities of Host Hotels & Resorts Inc., with a MacroRisk Level of 34 as of 2/10/2020. Notice that for Host the chart runs from -10 to 10.
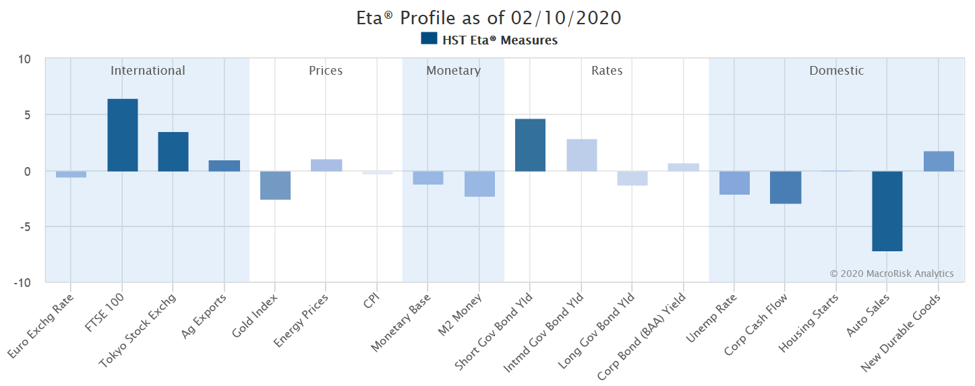
Comparing the two on the same graph emphasizes how much riskier AMD is than Host with respect to economic factors.
For context, the AMD estimated beta is 2.29 and the HST estimated beta is 0.95. AMD is more sensitive to market changes than is HST, but even though the beta statistic is twice HST, it understates the potential swings in AMD value relative to safer investments when there are economic shocks (e.g., 644 vs 34 MacroRisk Level).
MacroRisk Analytics® research is available on Interactive Brokers through our “The Economy Matters®” reports.
MacroRisk Analytics also has a selection of proprietary analysis tools that use macroeconomic variables to provide information on tens of thousands of stocks, mutual funds, exchange traded funds, and other traded assets. Click here to see how MacroRisk Analytics can help you.