Economic Sensitivities of the Nasdaq-100 Index – March 19, 2021 Update

Recently, many of us had probably noticed that when the 10-year U.S. government bond yield increased, the Nasdaq-100 Index tended to drop in value. This post will demonstrate what other economic exposures of the Nasdaq-100 are using the patented 18-factor model created by MacroRisk Analytics®. Financial advisors and investors can use this information to better understand the risks and opportunities involved with an investment in the Nasdaq-100.

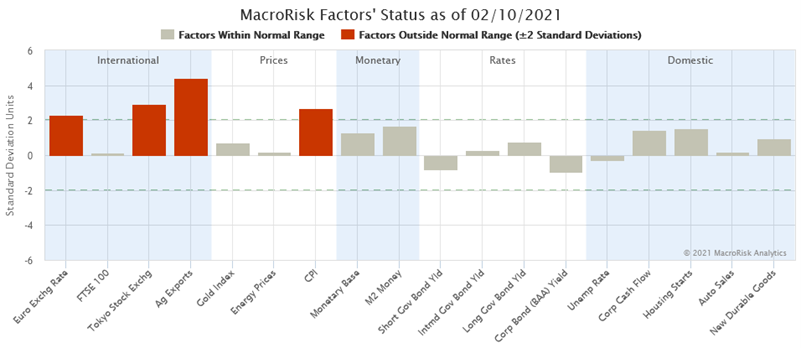
The MacroRisk Analytics model correctly identifies the relationship we had recently seen where the Nasdaq-100 would drop in value when the 10-year treasury yield increased. Using the Eta® Profile available on the MacroRisk Analytics platform, we can quickly identify this and other relationships the Nasdaq-100 has to other economic factors.

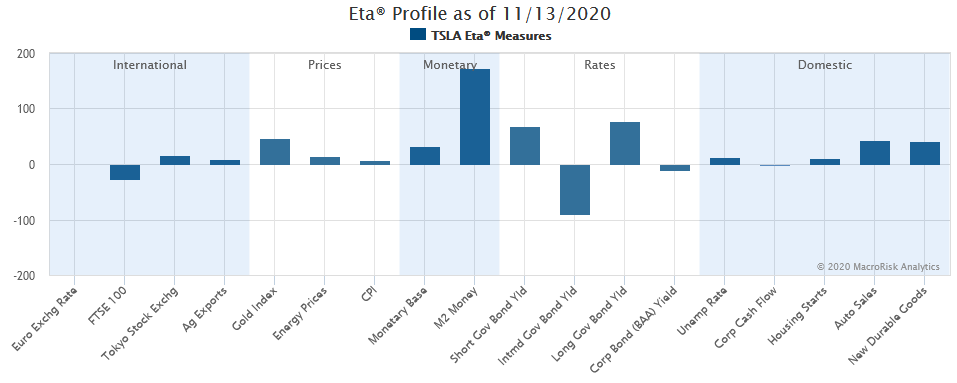
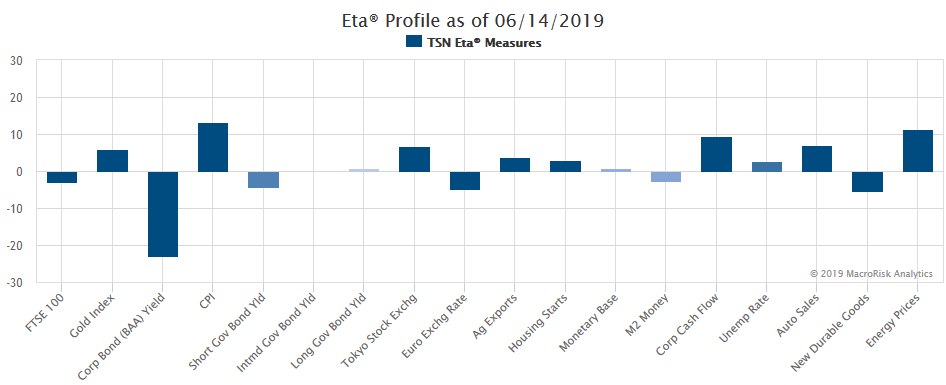
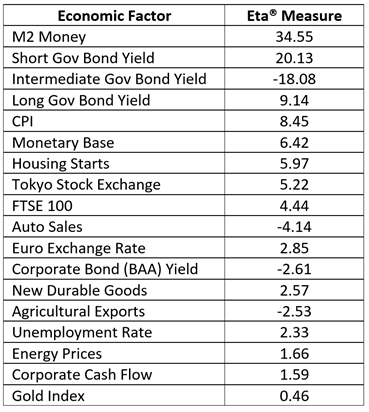
The Eta® measure in the graph below demonstrates the sensitivity of an asset to the economic factor. It reflects the expected change in an asset’s value given a one standard deviation increase in the economic factor. For instance, if the M2 Money factor increases by one standard deviation, the Nasdaq-100 is expected to increase 34.55% keeping other factors constant.

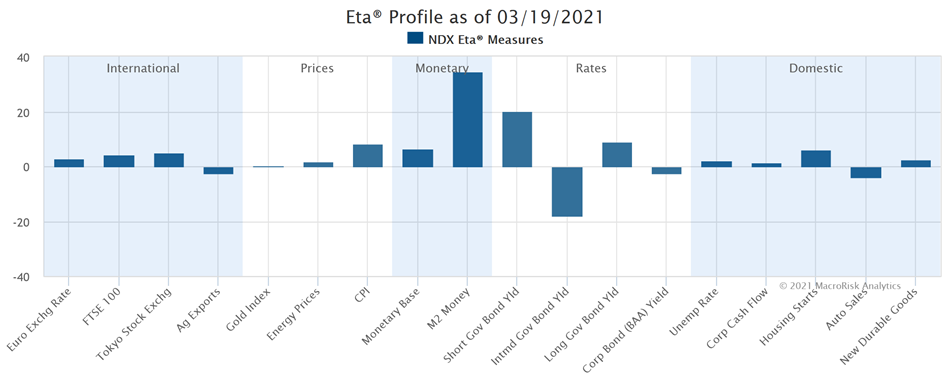
We can see that the Nasdaq-100 has a negative exposure to the intermediate government bond yield (i.e., the 10-year treasury yield). A negative exposure means that we can expect the asset to benefit if the economic factor decreases and vice versa. In other words, if the 10-year treasury yield increases, we can expect the Nasdaq-100 to drop in value holding other factors constant. This relationship is what we have recently seen happen in the market. While the chart above shows the economic sensitivities as of March 19, 2021, a similar relationship to the 10-year treasury yield existed at the beginning of 2021 before the interest rate spiked.

The chart also illustrates that the Nasdaq-100 does have other exposures to the economy, and in some cases, the profile deems these exposures to be stronger, more important exposures than the exposure to the intermediate government bond yield. For instance, we can expect the Index to have the biggest exposure to the M2 Money factor. This factor measures the money supply that includes cash, checking deposits, and easily convertible near money. In this case, the exposure is positive meaning that we can expect the Nasdaq-100 to benefit if M2 Money increases.

The Nasdaq-100 has the second largest exposure to the short-term government bond yield. This exposure is positive meaning that we can expect the Index to increase in value if the aforementioned factor increases and vice versa.

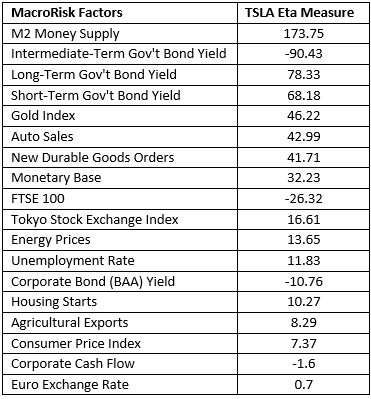
The table below demonstrates MacroRisk Analytics’ patented Eta® measures (i.e., economic sensitivities) of the Nasdaq-100 as of March 19, 2021. The table lists the sensitivities in descending order based on their absolute values.

This post’s goal was to help the reader understand the economic exposures of the Nasdaq-100 Index beyond what one may have deduced by observing the recent relationship between the 10-year treasury yield and its impact on the Nasdaq-100 value. Understanding the sensitivities of the Nasdaq-100 can help financial advisors and investors identify which economic factors are of more importance. This allows investment professionals to position their portfolios appropriately. 

This post is possible thanks to MacroRisk Analytics®. This platform provides investment research for 30,000+ individual names as well as investor portfolios. The MacroRisk Analytics® model uses 18 macroeconomic factors to break down the economy’s impact on investment value. Using this patented research, our team has twice won the William F. Sharpe Indexing Achievement Award for ETF/Indexing Paper of the Year. Click here to access this award-winning investment research today! You can find our other blog posts by clicking here.

Edited by Rania Sullivan.

Economic Climate for the Nasdaq-100 Stocks – February 10, 2021 Update

The stock market seems to be on a tear lately, a great contrast to about a year ago when the markets started to get roiled by Covid-19 developments. This post   uses the patented research on the MacroRisk Analytics® platform to demonstrate the economic climate for the Nasdaq-100 (NDX) stocks as of February 10, 2021  . This information may assist financial advisors and investors in navigating the current economic environment.

To demonstrate this, we use MacroRisk’s economic climate rating (ECR). This robust rating measures the expected impact of the current economic climate for individual assets (including stocks, funds, and many others) over the next six to 12 months. The ECR is a five-star scale where one indicates substantial economic storms in the forecast, and five indicates positive tailwinds with a favorable climate. A three ECR indicates a neutral economy.

As of February 10, 2021, the average ECR is 3.5. This rating means that investors can expect the economic climate to be neutral to favorable for the Nasdaq-100 stocks, on average.

Also, the distribution of ECR looks positive. The graph below shows that there are more Nasdaq-100 stocks for which the economic climate will most likely be favorable (e.g., ratings of four and five) than those stocks for which the climate is expected to be not favorable (e.g., rating of one and two). As of February 10, 2021, there are no stocks in the Nasdaq-100 Index for which the economy is expected to be very unsuitable (e.g., rating of one).

The MacroRisk Analytics model uses 18 macroeconomic factors to determine a stock’s sensitivities to changes in the economy. The ECR combines the economic sensitivities of a stock to the economy with what is actually happening in the economy to determine if the economy is expected to be suitable, not suitable, or neutral for the particular stock.

To illustrate what is currently happening in the economy, we will use the MacroRisk Analytics platform to give us an overview of the state of the economy as of February 10, 2021.

The bars in the graph above indicate where the particular economic factor is relative to its recent moving average. If the bar is above zero, this means that the factor is trending up relative to its recent average and vice versa. The bars highlighted in red bring our attention to the factors most worth paying attention to as they are potentially exhibiting strong, non-random movements. As of February 10, 2021, international factors such as the dollar/euro exchange rate, Tokyo stock exchange, and U.S. agricultural exports are three critical factors. A fourth important factor is the domestic U.S. inflation (i.e., CPI).

Finally, below are ten stocks out of the Nasdaq-100 Index (NDX) that are proposed to be at least somewhat suitable in the current economy (i.e., ECR of four or higher) and that have the highest up-market beta relative to NDX meaning that these stocks tend to go up more than NDX when NDX goes up. The chart shows the data as of February 10, 2021.

The ECR has changed drastically from about a year ago when the ECR was stormy for most Nasdaq stocks. The above data show the economic outlook is expected to be much improved for most Nasdaq-100 stocks. Also, it seems that international factors and U.S. inflation are of more importance now as they exhibit the biggest changes relative to their recent averages. Finally, this post provides a list of ten Nasdaq-100 stocks with an ECR of four or five stars, with the highest up-market beta relative to NDX.

This post is possible thanks to MacroRisk Analytics®. This platform provides investment research for 30,000+ individual names as well as investor portfolios. The MacroRisk Analytics® model uses 18 macroeconomic factors to break down the economy’s impact on investment value. Using this patented research, our team has twice won the William F. Sharpe Indexing Achievement Award for ETF/Indexing Paper of the Year. Click here to access this award-winning investment research today! You can find our other blog posts by clicking here.

Edited by Rania Sullivan.

Tesla’s Exposures to the Economy – November 13, 2020 Update

This post will demonstrate Tesla’s exposures to 18 MacroRisk factors (i.e., economic factors) via the Eta® profile on the MacroRisk Analytics® platform as of November 13, 2020. Understanding these exposures can help financial advisors and investors identify potential economic risks the company is exposed to and invest accordingly. Since the information presented herein uses proprietary and patented analysis, a unique look at Tesla is provided unlike many other posts about Tesla.

An asset’s Eta profile is the combination of its 18 Eta measures. Each Eta measure is a description of how an asset typically responds to a specific change in the economy (based on recent history). Eta measures that are positive indicate that an asset increases in value when the corresponding MacroRisk factor rises; conversely, Eta measures that are negative indicate that an asset’s price decreases when the corresponding MacroRisk factor rises.

The Eta profile for Tesla as of November 13, 2020 is shown below.

The bigger the bar (up or down), the bigger the expected effect the particular economic factor has on Tesla’s stock price and vice versa. If a bar points up, Tesla’s stock is expected to increase if the particular economic factor increases and is expected to decrease if the economic factor decreases. If a bar points down, Tesla’s stock is expected to increase if the particular economic factor decreases and is expected to decrease if the economic factor increases. In other words, when Tesla’s economic factor sensitivity is aligned with what is happening with that economic factor, Tesla’s stock is expected to benefit from the change in that economic factor, and when they are not aligned or are not in the same direction, Tesla’s stock is expected to decrease from that economic factor change.

The table below identifies the exact exposures for each of the 18 MacroRisk factors shown in the previous graph.

The numbers in the table above show the expected effect on Tesla’s price given a one standard deviation increase in the economic factor. To help interpret one of the numbers above, Tesla’s Eta measure of 173.75 for M2 money supply means that if M2 money supply increases by one standard deviation, Tesla’s stock price is expected to increase by approximately 173.75 percent. On other hand, Its stock price is expected to decrease by 173.75 percent if there is a one standard deviation decrease in the economic factor. Definition for M2 money supply can be found here.

As of November 13, 2020, Tesla stock’s biggest exposure was to M2 money supply. We can see that over time M2 money supply has increased which might be a good driver for the stock price going forward. Here is the graph for M2 money supply since 1989.

Tesla also has high exposures to interest rates: short-, intermediate-, and long-term. It is expected to benefit from a decrease in intermediate-term government bond yields and from an increase in short- and long-term government bond yields.

To summarize, this post has shown Tesla’s sensitivities to 18 MacroRisk factors as illustrated on the MacroRisk Analytics platform. Using this information, investors can identify which economic factors are expected to have the biggest effects on Tesla’s stock price.

At www.MacroRisk.com, you are able to generate Eta profile reports for your portfolios as well as thousands of individual assets and much more. We also provide our “The Economy Matters®” reports on Interactive Brokers, FactSet, Capital IQ, and Refinitiv.

Economic Stats of Pharmaceutical Companies Developing a Covid-19 Vaccine

This post will analyze and compare some pharmaceutical companies developing a vaccine for Covid-19 from an economic perspective using the Eta® statistics on the MacroRisk Analytics® platform. These statistics can assist financial advisors and investors in understanding what economic forces have been driving the stock prices of these companies and how these companies compare in terms of economic risk.

According to a Forbes article dated June 16, 2020, the following five pharmaceutical companies are developing a Covid-19 vaccine:

The table above presents only some of the companies developing a vaccine for Covid-19. (Moderna is another company, for example, that is developing a vaccine but was not analyzed in this post because its stock does not have at least three years of trading history).

These five companies will be compared using the FiveRisks report by MacroRisk Analytics as of November 6, 2020.

Economic Climate Rating

The first statistic that will be analyzed is the economic climate rating. It is a star rating ranging from one to five stars. A rating of one means that the current economy is expected to not be suitable for the asset (i.e., the economy is expected to provide headwind). A rating of three means the economy is expected to be neutral for the asset. A rating of five means that the current economy is expected to be suitable for and benefit the asset (i.e., the economy is expected to provide tailwind). Here are the economic climate ratings for the five companies.

Novavax had the highest economic climate rating of four meaning the economy is expected to be somewhat favorable compared to other companies for which the economy is expected to be neutral.

MacroRisk Level

The second statistic is the MacroRisk Level (MRL) which measures how sensitive an asset is to changes in the economy. The lower the MRL, the lower the asset’s economic risk is expected to be and vice versa. Here are the MRLs for the five companies and also the median, average, minimum and maximum MRLs for the S&P 500 index for comparison.

As can be seen, Novavax stands out withs a very high MRL of 1983. This is higher than the maximum MRL of 930 in the S&P 500 Index as of November 6, 2020 illustrating the high level of economic risk associated with the stock of this company.

Economy’s Influence

The economy’s influence measures how much of the stock price of an asset is driven by changes in the economy rather than company specific information. The higher the value, the more the asset is driven by the economy and vice versa.

Johnson & Johnson as well as Pfizer have low economy’s influence statistics demonstrating that the stock prices of these companies are believed to be driven more by company specific information than what happens in the economy.

Eta® Value at Risk

The Eta Value at Risk statistic measures the expected percent change in the price of an asset, up or down, given an unexpected event that has a five percent probability of happening (whatever this event may be). This is a measure of risk. The lower the statistic, the lower the expected risk of an asset is believed to be and vice versa.

Again, Novavax illustrates high expected risk with the Eta Value at Risk of 48.9%. This means that given an unexpected event with a five percent probability, its stock price is expected to increase or decrease by 48.9%.

Down-market Beta

The down-market beta measures downside risk. It is the expected percent change in the value of an asset when the S&P 500 Index (in this case) drops. If the down-market beta is less than one, the asset is expected to lose less value than the S&P 500 when the S&P 500 drops. If the down-market beta is higher than one, the asset is expected to lose more value than the S&P 500 Index when the index drops. The lower the down-market beta, the less risky an asset is expected to be and vice versa.

In terms of the down-market beta, all of the subject companies except one have lower risk than the average company in the S&P 500. Novavax has somewhat higher risk than the average S&P 500 company with the down-market beta of 1.14 which means that if the S&P 500 Index drops by one percent, the stock price of Novavax is expected to drop by 1.14 percent (i.e., if the S&P 500 drops by 10%, Novavax is expected to drop by 11.4%).

Summary

The goal of this post was to provide some statistics to analyze some of the pharmaceutical companies currently developing a vaccine for Covid-19 from an economic perspective. These statistics show where these companies stand in terms of economic risk in relation to the S&P 500 Index.

The table below will summarize the statistics presented earlier in this post. These statistics are as of November 6, 2020.

The statistics shown in this post can be accessed through the MacroRisk Analytics platform. This platform helps analyze portfolios and thousands of companies, mutual funds, ETFs, etc. with the economy in mind because The Economy Matters®.

Our “The Economy Matters Reports” are also available through Interactive Brokers, FactSet, Capital IQ, and Refinitiv.

When so many stocks are down, which are undervalued? MacroRisk’s Relative Value Index can help.

The COVID-19 virus continues to spread around the world and seems to have “infected” investors with fear and panic. The market’s volatility has spiked, and major indexes around the world have dropped from their recent highs. In times like these, panic and emotion seem to drive the market swings rather than the underlying economic conditions. Some financial advisors and investors might be trying to take money off the table before they lose more while others jump at this opportunity to purchase assets at fire-sale prices.

To assist financial advisors and investors with investment analysis, we will provide a list of 20 NASDAQ stocks with high market cap and estimate how overvalued or undervalued these stocks are using the Relative Value statistic provided by the MacroRisk Analytics® platform because a reasonable question always arises: is what I plan to purchase undervalued, overvalued, or fairly valued? While typical  analytics products emphasize accounting analysis or technical ratios to determine price valuation, the MacroRisk Analytics platform provides “a better window on the future”®.  Its patented and proprietary tools can help investors take emotions out of the investment decision-making process and focus on how the underlying economic values of their investments, including most stocks and funds traded in the U.S. and Canada.  Of particular note is the “relative value statistic” which presents the extent to which an asset is under- or over-valued; this statistic compares the Eta® price (i.e., MacroRisk’s statistical estimate of an asset’s intrinsic price) to the corresponding market price of the asset.

MacroRisk’s Eta® price estimate is computed using advanced data analysis and considers the specific impacts of these 18 macroeconomic variables:

  1. Short-term government bond yield
  2. Intermediate-term government bond yield
  3. Long-term government bond yield
  4. Corporate bond (BAA) yield
  5. Unemployment rate
  6. Corporate cash flow
  7. Housing starts
  8. Auto sales
  9. New durable goods
  10. Gold index
  11. Energy prices
  12. CPI (inflation)
  13. Monetary base
  14. M2 Money
  15. Euro exchange rate
  16. FTSE 100
  17. Tokyo stock exchange
  18. Agricultural exports

Similar to how factors such as the number of bedrooms, number of baths, square footage, etc. determine the price  of a house, these 18 macroeconomic variables determine the intrinsic value estimate, the Eta® price of an asset.

The relative value statistic is interpreted as follows:

Relative Value by MacroRisk Analytics Valuation Expectation
<1 Expected to be overvalued
1 Expected to be fairly valued
>1 Expected to be undervalued

To illustrate the relative value score, consider the following list of 20 large cap NASDAQ stocks and their corresponding relative value statistics as of 3/16/2020:

Name Symbol Relative Value as of 3/16/2020
CME Group Inc CME 1.361
Exelon Corp EXC 1.306
CSX Corp CSX 1.202
The Kraft Heinz Co KHC 1.161
Automatic Data Processing Inc ADP 1.131
Pepsico Inc PEP 1.128
Mondelez International Inc MDLZ 1.108
Microsoft Corp MSFT 1.102
Intel Corp INTC 1.099
Starbucks Corp SBUX 1.082
Apple Inc AAPL 1.078
Nvidia Corp NVDA 1.057
Intuit Inc INTU 1.043
Analog Devices Inc ADI 1.034
Equinix Inc EQIX 1.027
Qualcomm Inc QCOM 1.016
Comcast Corp CMCSA 0.962
Texas Instruments Inc TXN 0.949
Cisco Systems Inc CSCO 0.948
Marriott International MAR 0.943

According to the current economic conditions, even with all the current social volatility disrupting markets, 16 out of these 20 stocks presented seem to be potential buy targets because their relative value statistics are over 1; their market prices are substantially below MacroRisk’s statistically based  intrinsic values estimates.

During turbulent times that we are currently experiencing, it is ever more important to keep emotions in check while investing. The relative value tool statistic allows investors to take a step back from the speculation going on in the world and focus on whether an asset is expected to be under- or over-valued based on the current economy. The relative value information presented for 20 NASDAQ stocks above uses the underlying economic conditions expected to drive the values of assets over the long-term.

When you are considering changing your holdings, whether in a crisis or not, the Relative Value Index can help pinpoint undervalued opportunities.

www.MacroRisk.com provides relative value and other statistics as well as a selection of patented and  proprietary analysis tools for tens of thousands of stocks, mutual funds, ETFs, and other traded assets. The Relative Value Score for stocks and funds is also included in “The Economy Matters” reports available from numerous platforms.  Click here to see how MacroRisk Analytics can help you. 

Mr. Rolland Harris assisted with the preparation of this post.

The Economic Climate is Stormy for Most NASDAQ Stocks

The market is getting whipsawed by negative news regarding the coronavirus and potential profit and supply chain disruptions, at the same time unemployment rates and interest rates are at record lows.  While the focus is largely on the public health disruptions, eventually the market will again focus on the economy and its impact on profits and growth.  Research by MacroRisk has shown that different companies have different responses to economic variables, and that the same set of economic conditions might be favorable for some companies and unfavorable for others.  The most valuable, and seemingly the most turbulent, stocks appear to be those on the NASDAQ.  In this report, we ask what the economic climate might be for NASDAQ stocks when the social angst calms down and investors care about profits, costs, and more mundane economic factors of investing.

Using the patented and proprietary tools available on the MacroRisk Analytics® platform, we will show the distribution of NASDAQ stocks that are currently expected to be suitable in the current economy to those stocks that are not. This can help investors and financial advisors understand what portion of stocks is expected to benefit from current economic conditions and which portion is not. It will help to answer the following question: what portion of stocks does the economy provide tailwind for, headwind for or is neutral for? This, in turn, can assist in understanding where the overall economy currently stands.

To demonstrate this, we use MacroRisk’s “economic climate rating (ECR)” based on its patented technology. This powerful rating measures the expected impact of the current economic climate for individual assets (including stocks, funds, and many others) over the next six to 12 months.  The ECR is a five-star scale where one indicates substantial economic storms in the forecast and five indicates positive tailwinds and a favorable climate.

As of 3/9/2020, the average economic climate rating is 2.2 for covered NASDAQ stocks (those with at least three years of trading history). Overall, the forecasted economic climate is somewhat unfavorable for NASDAQ stocks.  On the other hand, there are some NASDAQ stocks which seem to have their corporate sales perfectly trimmed to catch the economic breezes, and they receive a 5-star rating.

The distribution of the economic climate rating is presented in the following graph.  The graph below shows that there are more of 1- and 2-star stocks than 4- and 5-star stocks as of 3/9/2020.

The economic climate rating is based on each stock’s unique response to key 18 economic factors in conjunction with the current values of those factors.  The graph below shows the current economy expressed as “z scores”, that is in a way that adjusts for different magnitudes and different volatilities.  In the chart below, each bar shows the current economic value compared to its historical values.  The economic climate rating is computed using the current values and doesn’t include additional economic forecasting.

Given that there are more stocks for which the current economy is expected to not be suitable than those for which it is, investors might consider a more defensive approach to their portfolios. This analysis assumes that the economic factors will continue in their current directions. Alternatively, investors may choose to focus on those where the economy is most favorable.

The next table shows the top 10 NASDAQ stocks in terms of their economic climate as of 3/9/2020. In other words, these are the 10 stocks that are believed to be most undervalued according to the 18 macroeconomic factor MacroRisk model.

MacroRisk Analytics® research is available on Interactive Brokers through our “The Economy Matters®” reports.

MacroRisk Analytics also has a selection of proprietary analysis tools, including the economic climate rating discussed in this post, that use macroeconomic variables to provide information on tens of thousands of stocks, mutual funds, exchange traded funds, and other traded assets. Click here to see how MacroRisk Analytics can help you. 

Economic Outlook for a Stock with the Highest Return-to-risk Ratio in 2019 through June 10

Using patented macroeconomic information provided by MacroRisk Analytics, we will discuss the economic outlook for Tyson Foods Inc. mentioned in our “Stocks with Highest and Lowest Return-to-risk Ratios Year-to-date” blog post on June 12, 2019.

In our previous post, we have identified Tyson Foods Inc. (ticker: TSN) as having the highest return-to-risk ratio out of the S&P 500 stocks from 12/31/18 through 6/10/19. The company’s economic profile as of 6/14/19 as demonstrated in the MacroRisk Report by MacroRisk Analytics is:

MacroRisk Level

The MacroRisk Level (MRL) measures an asset’s sensitivity to economic change (i.e. another measure of an asset’s risk). Tyson Foods’ MRL is 107. Is this number too high, too low? To answer this question, let’s compare Tyson’s MRL to other companies in the consumer staples sector. Using MacroRisk Analytics, we uploaded the consumer staples holdings referencing the XLP holdings (SPDR ETF for consumer staples) as of 6/14/19 into a buylist. Next, we used the FiveRisks+ Holdings Table by MacroRisk Analytics to analyze the sector’s holdings versus Tyson Foods.

Name Symbol MRL
Archer-Daniels-Midland Co ADM 87
Coca-Cola Co (The) KO 103
Sysco Corp SYY 103
Tyson Foods Inc TSN 107
Campbell Soup Co CPB 111
Colgate-Palmolive Co CL 119
Monster Beverage Corp MNST 130
Mondelez International Inc MDLZ 140
Brown Forman Corp BF.B 141
Kimberly-Clark Corp KMB 141

As of 6/14/2019, there were 33 holdings in the consumer staples sector. The tables above show only a few of the holdings within the SPDR Consumer Staples ETF. The tables are sorted by the MRL from lowest to highest. Tyson Foods is similar to Sysco Corp and Campbell Soup in its sensitivity to changes in the economy. Among the 33 holdings in the consumer staples sector, the lowest MRL in 87 (Archer-Daniels-Midland) and the highest is 292 (Walgreens Boots Alliance). As a reminder, the MRL for Tyson Foods is 107. Within the consumer staples sector, Tyson Foods’ MRL percentile rank is 10%. In other words, 10% of companies in the consumer staples have a lower MRL and 90% have a higher MRL (i.e., 90% of the consumer staples sector holdings have higher risk as measured by their stock price response to the economy).

Economic Climate Rating

The Economic Climate Rating (ECR) measures how favorable the current economic climate could be for an asset (i.e., a stock) over the next 6 to 12 months. It is a 5-star scale: 1 being the worst, 5 being the best. Tyson Foods’ ECR is a 4 meaning that the current economy could be considered favorable for the company. Exporting the FiveRisks report by MacroRisk Analytics to an Excel spreadsheet, we can summarize the ECRs as follows:

The distribution of the ratings is positively skewed meaning that there are more companies in the consumer staples sector with ratings below 3. This may indicate that currently, the economy is expected to be neutral or not favorable to the majority of companies in that sector.

Economy’s Influence

The Economy’s Influence shows how much of an asset’s price and value movement is explained by changes in the economy. Our model indicates 82% of Tyson Foods’ stock price is explained by changes in the economy, and we attribute the other 18% to company-specific information. This is a relatively low number because the average portion of the stock price movement that is explained by the economy in the consumer staples sector as of 6/14/19 is approximately 88%. Our model indicates that about 20% of the companies (i.e., their stock prices) in the sector are less influenced by the economy and about 80% of the companies (i.e., their stock prices) are more influenced by the economy.

Eta® Profile

Finally, we would like to show another patented, proprietary economic analysis for Tyson Foods. And, it is the Eta® profile or what we call the “DNA” of the company. If you are a new reader and would like to learn how to understand the Eta® profile, click here. Here’s the Eta® profile for Tyson Foods:

Currently, the company’s top 3 sensitivities are to:

  • corporate bond (BAA) yield
  • CPI (inflation)
  • energy prices

Tyson’s stock price is negatively influenced by the BAA yield meaning that if the BAA yield were to decrease, this would be expected to benefit the stock’s price and vice versa. On the other hand, it is positively influenced by the CPI and energy prices meaning that if these two factors were to increase, this would be expected to benefit the stock’s price and vice versa.

Here’s a variation of the Eta® profile where the current economic status is also presented:

It can be seen that the BAA yield has actually decreased (see the direction of the non-blue bar for the BAA yield factor in the chart above), and the CPI and energy prices have increased relative to their recent levels.

Here’s a graph of Tyson’s stock price versus the S&P 500 Total Return Index from 12/29/2017 through 6/14/2019:

MacroRisk Analytics has a selection of proprietary analysis tools that use macroeconomic variables to provide information on tens of thousands of stocks, mutual funds, exchange traded funds, and other traded assets.  By using these tools to evaluate Tyson Foods (TSN), we believe that the company has lower overall economic risk, and a more favorable macroeconomic status compared to other companies in its sector.  A more detailed examination shows that recent changes in the CPI and Corporate Bond Yields have particular impact. Click here to see how MacroRisk Analytics can help you. 

New asset allocation tools released!

We have added “Asset Allocation” tools to the “Fiduciary Optimization” and “Institutional Research” subscription levels!  With the new tools, risk parity, generalized MPT, and minimum variance optimization join the existing Optimization Tool offering MacroRisk’s patented Black Swan optimization, maximum Sharpe and Sortino portfolios, and benchmark replication routines.