After a time of seemingly economic stability, the potential for economic shock is growing. With looming trade wars and trade war disruptions, concerns over interest rates, and the usual turmoil going into a presidential election cycle, we used the MacroRisk platform to identify the ten S&P stocks with the highest exposure to 18 key economic factors and the 10 with the lowest exposure to these factors.
The MacroRisk platform provides daily estimates of a “MacroRisk level” for almost every traded U.S. and Canadian stock and fund, using a proprietary set of 18 “Eta® Factors” including International factors (Euro, FTSE100, Tokyo Stock Exchange, and Ag Exports), Prices (Energy, CPI, Gold), Monetary factors (Monetary Base and M2), and Domestic factors (unemployment rate, corporate cash flow, auto sales, and orders for new durable goods). The “MacroRisk Level” measures the overall exposure of assets and portfolios to these 18 factors.
For comparison, here are the current values of several key indices:
| Index | MacroRisk Level |
| Russell Midcap | 46 |
| S&P Equal Weight | 47 |
| Wilshire 5000 | 49 |
| Russell 1000 | 55 |
| S&P 500 | 59 |
| MSCI Emerging Markets | 61 |
| NASDAQ Comp | 62 |
| S&P MidCap 400 | 69 |
| Dow Jones 30 | 75 |
| Russell 2000 | 106 |
We then used the MacroRisk.com platform and screened over the current constituents of the S&P 500 index and identified the following as the stocks with the greatest exposure:
| Name | Symbol | MacroRisk Level |
| Nektar Therapeutics | NKTR | 939 |
| ABIOMED Inc | ABMD | 552 |
| Micron Technology Inc | MU | 502 |
| Align Technology Inc | ALGN | 479 |
| Hollyfrontier Corp | HFC | 478 |
| Netflix Inc | NFLX | 477 |
| Advanced Micro Devices Inc | AMD | 475 |
| IPG Photonics Corp | IPGP | 456 |
| Xilinx Inc | XLNX | 422 |
| Anadarko Petroleum Corp | APC | 415 |
The following are the lowest ten in terms of MacroRisk level:
| Name | Symbol | MacroRisk Level |
| Westar Energy Inc | EVRG | 61 |
| Loews Corp | L | 62 |
| Torchmark Corp | TMK | 65 |
| Omnicom Group Inc | OMC | 70 |
| Intercontinental Exchange Inc | ICE | 71 |
| AFLAC Inc | AFL | 74 |
| Digital Realty Trust Inc | DLR | 76 |
| Alexandria Real Estate Equities Inc | ARE | 78 |
| Huntington Bancshares Inc | HBAN | 78 |
| Boston Properties Inc | BXP | 79 |
The following chart shows some summary statistics and the graphical presentation of an equally weighted portfolio of the ten highest MacroRisk Level stocks, the ten lowest MacroRisk Level stocks, and the SPY as a measure of overall market attainability.
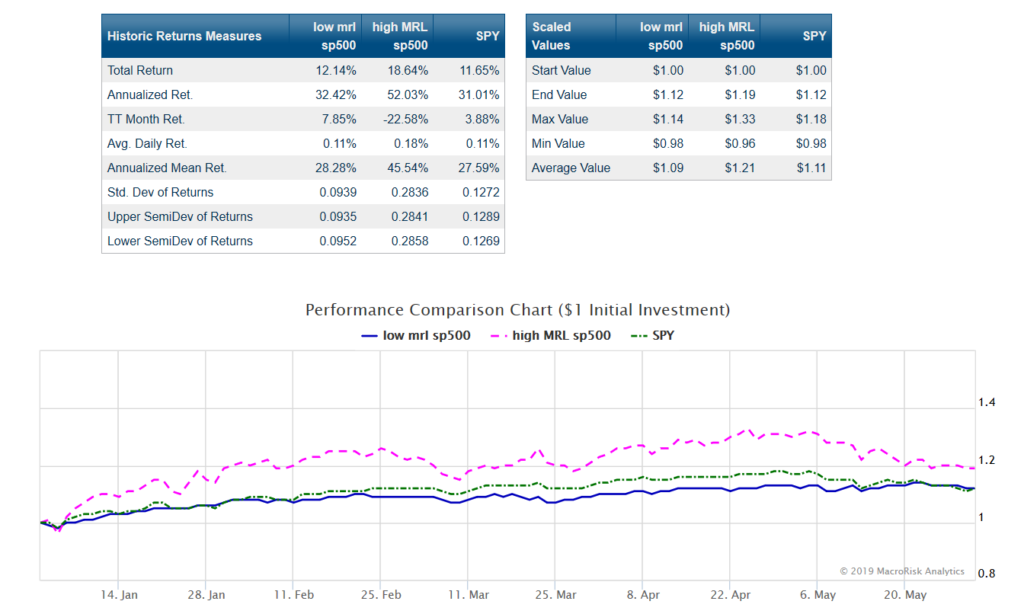
A final measure is to compute the ratio of the total return to the corresponding standard deviation of returns for the low exposure, high exposure, and SPY portfolios. This measure is like a Sharpe ratio and measures return per unit risk.
Using this method, the return to risk ratio for the SPY is 0.916, the ratio for the high exposure portfolio is 0.657, and the ratio for the low exposure portfolio is 1.293 using data from 1/1/2019 through the end of May.
While the SPY and high exposure portfolios have generally produced higher returns over this period, the smooth dark blue line, the low MacroRisk Level stocks, produced a superior risk adjusted return. Investors interested in diversifying away exposure to economic exposure during the coming months may want to consider this type of analysis using www.MacroRisk.com.