As of this writing, the latest U.S. annual inflation rate came at 9.1 percent for the month of June 2022. Milton Friedman, an American economist and recipient of the 1976 Nobel Memorial Prize in Economic Sciences, once said, “inflation is always and everywhere a monetary phenomenon in the sense that it is and can be produced only by a more rapid increase in the quantity of money than in output.” We will share our thoughts regarding the future path of U.S. inflation in the near future (say a year) using the money supply via the monetary base and the M2 money factors. The MacroRisk Analytics platform is utilized to show changes in the money supply and inflation.
As the inflation data in the table below shows, annual inflation had been relatively low from 2012 through 2020, but in April of 2021, annual inflation spiked to 4.2 percent, and we highlight this month in the table below to represent the starting month of a shift in inflation.
The annual inflation rate for the 12-month period ending on the month and year shown:
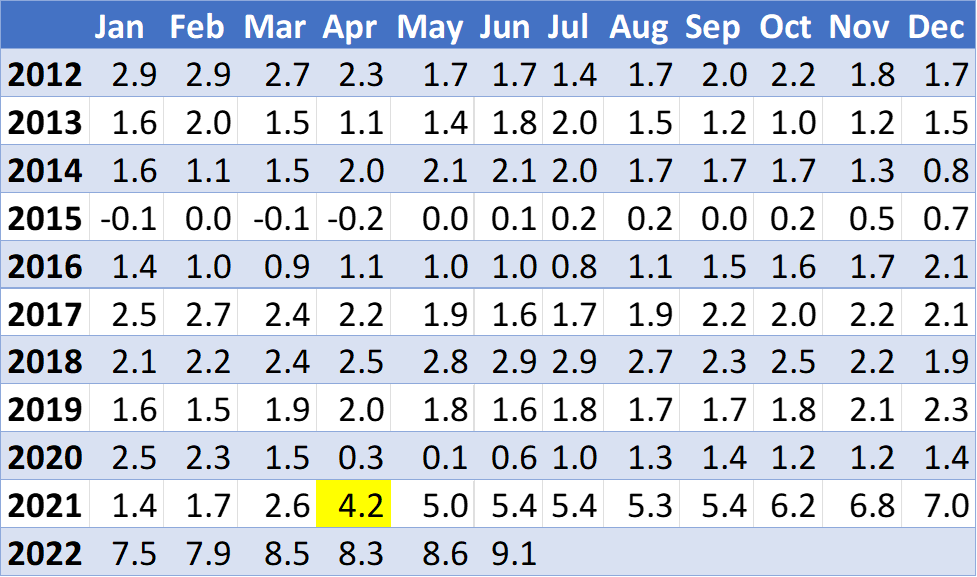
Source: U.S. Bureau of Labor Statistics
Using the MacroRisk Analytics platform, we will review the relationship between money supply and lagged inflation. The goal is to identify major changes in these factors and when they happened.
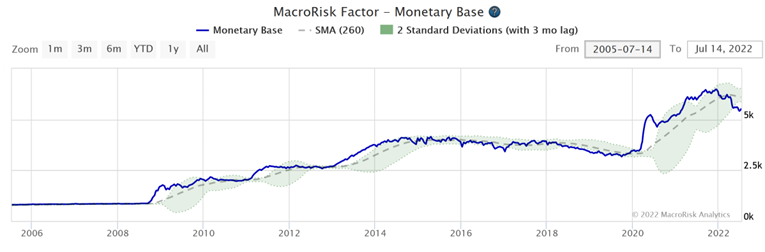
The graph below shows the changes in the U.S. monetary base from 2005 until the present (July 14, 2022). The monetary base measures how much currency is actually in the United States. It includes all paper money, coins, and bank reserves. The monetary base spiked starting around March 2020. About one year after the monetary base started to increase, the inflation started to increase in April 2021.
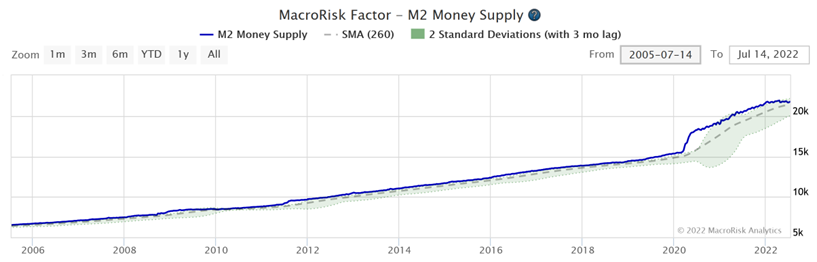
Now, let’s look at the M2 money factor and how it has changed over time, as shown in the graph below. The M2 money is a broader measure of money supply that includes the previously mentioned monetary base plus demand deposits (money in checking accounts), and other saved money (savings accounts, money market funds, and small-amount certificates of deposit). Similarly, M2 money started to increase in March 2020, and about a year later, in April 2021, inflation began to increase. Prior to March 2020, the M2 money supply exhibited steady growth with no significant changes. We think the M2 money factor could be a more reliable and independent variable for predicting changes in inflation than the monetary base discussed previously because a jump in the M2 money factor was followed by a jump in inflation about a year later, whereas when the monetary base substantially increased starting in 2008, it did not cause a significant spike in inflation in the following years.
Now, to the question, will the U.S. inflation slow down or continue to increase in the near future (the next 12 months)?
The monetary base started to drop in December 2021. The M2 money supply slowed down in January 2022, peaked in April 2022, and has been decreasing slightly since then. Based on these two factors, the money supply is tightening (or at least not growing). Since new money is not being introduced into the economy, we expect the inflation rate to decrease starting around the 2nd quarter of 2023 if this downward trend in the money supply continues. Our reasoning for this time frame is that it took about a year after the money supply started to increase (especially the M2 money supply) in March 2020 until the inflation rate also started to increase in April 2021. Since the money supply peaked around the 1st and 2nd quarter of 2022, we predict that in about a year, around the 2nd quarter of 2023, the inflation rate will start to decrease. Until then, the inflation rate might stay at elevated levels.
While the purpose of this post is to explore the relationship between money supply and inflation, there are other variables that can affect inflation. We discuss some of these variables next. First, the central bank is raising interest rates which is expected to slow the economy and decrease demand which, in turn, is expected to put downward pressure on prices. The U.S. might even enter a recession because of this. Second, commodity prices have been dropping lately, which is expected to decrease input prices and again put a downward pressure on retail prices. Oil prices which have substantially increased over the past year, are showing signs of a slowdown where U.S. gas prices are at a two-month low as of July 19, 2022. Decreasing commodity prices could be another sign of a coming recession. Third, U.S. business inventories have been on the rise. Inventories spiked for companies such as Target and Costco. Higher inventory (i.e., higher supply) is expected to put downward pressure on prices. Companies are more likely to provide discounts. It looks like we might be shifting from a period of shortages that might have caused companies to overproduce, resulting in a glut of inventories mentioned previously.
This is why we believe that the U.S. will not experience runaway inflation, but instead we expect the inflation to start decreasing with our estimate sometime in the first half of 2023.
The analysis above was done with the help of the MacroRisk Analytics platform.