Tesla’s Exposures to the Economy – November 13, 2020 Update

This post will demonstrate Tesla’s exposures to 18 MacroRisk factors (i.e., economic factors) via the Eta® profile on the MacroRisk Analytics® platform as of November 13, 2020. Understanding these exposures can help financial advisors and investors identify potential economic risks the company is exposed to and invest accordingly. Since the information presented herein uses proprietary and patented analysis, a unique look at Tesla is provided unlike many other posts about Tesla.

An asset’s Eta profile is the combination of its 18 Eta measures. Each Eta measure is a description of how an asset typically responds to a specific change in the economy (based on recent history). Eta measures that are positive indicate that an asset increases in value when the corresponding MacroRisk factor rises; conversely, Eta measures that are negative indicate that an asset’s price decreases when the corresponding MacroRisk factor rises.

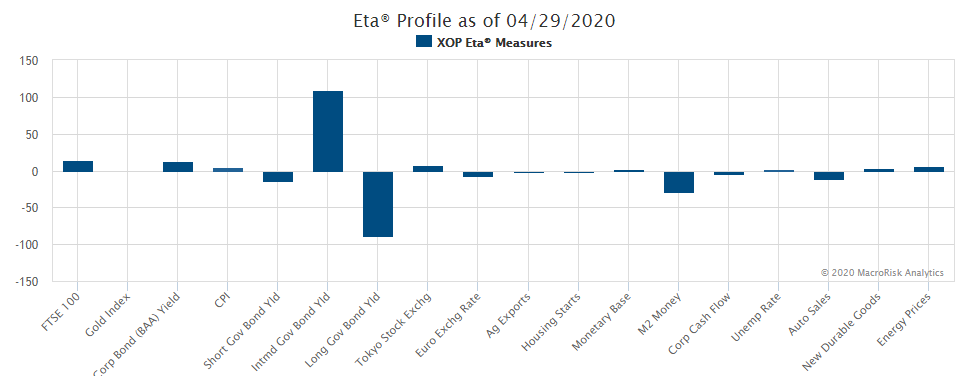
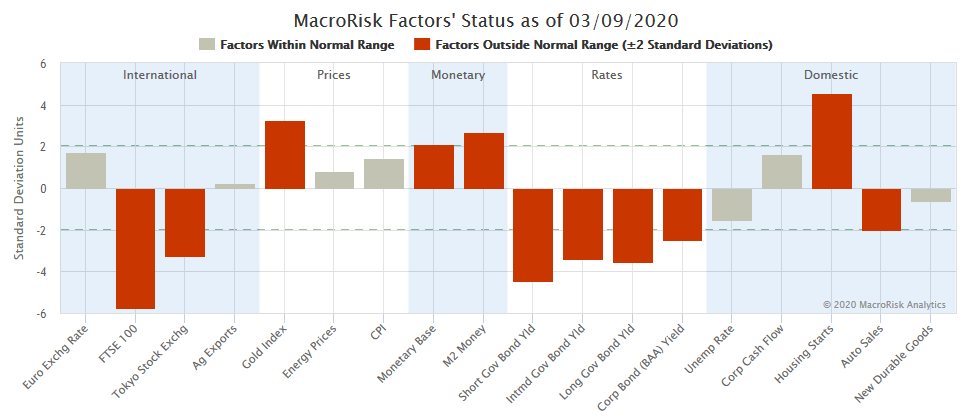
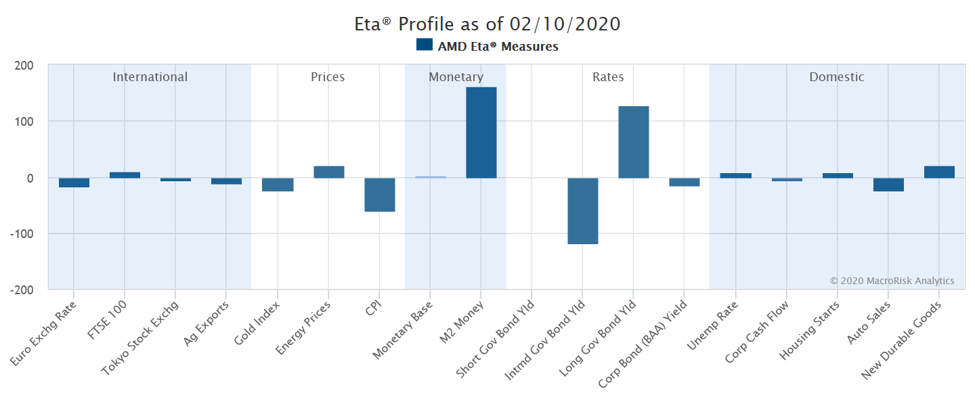
The Eta profile for Tesla as of November 13, 2020 is shown below.

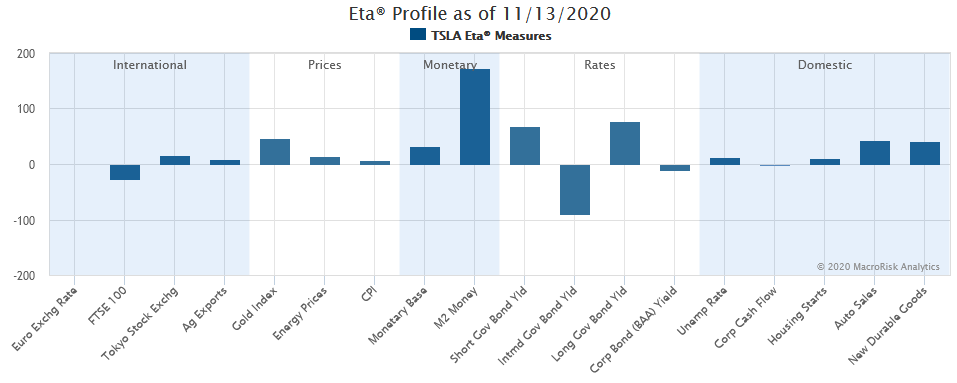
The bigger the bar (up or down), the bigger the expected effect the particular economic factor has on Tesla’s stock price and vice versa. If a bar points up, Tesla’s stock is expected to increase if the particular economic factor increases and is expected to decrease if the economic factor decreases. If a bar points down, Tesla’s stock is expected to increase if the particular economic factor decreases and is expected to decrease if the economic factor increases. In other words, when Tesla’s economic factor sensitivity is aligned with what is happening with that economic factor, Tesla’s stock is expected to benefit from the change in that economic factor, and when they are not aligned or are not in the same direction, Tesla’s stock is expected to decrease from that economic factor change.

The table below identifies the exact exposures for each of the 18 MacroRisk factors shown in the previous graph.

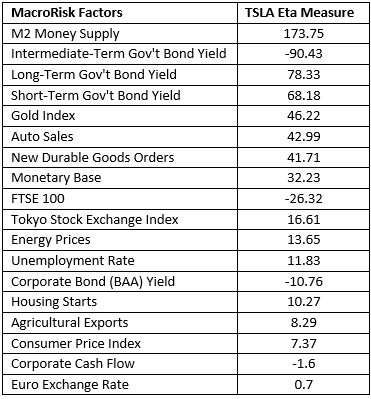
The numbers in the table above show the expected effect on Tesla’s price given a one standard deviation increase in the economic factor. To help interpret one of the numbers above, Tesla’s Eta measure of 173.75 for M2 money supply means that if M2 money supply increases by one standard deviation, Tesla’s stock price is expected to increase by approximately 173.75 percent. On other hand, Its stock price is expected to decrease by 173.75 percent if there is a one standard deviation decrease in the economic factor. Definition for M2 money supply can be found here.

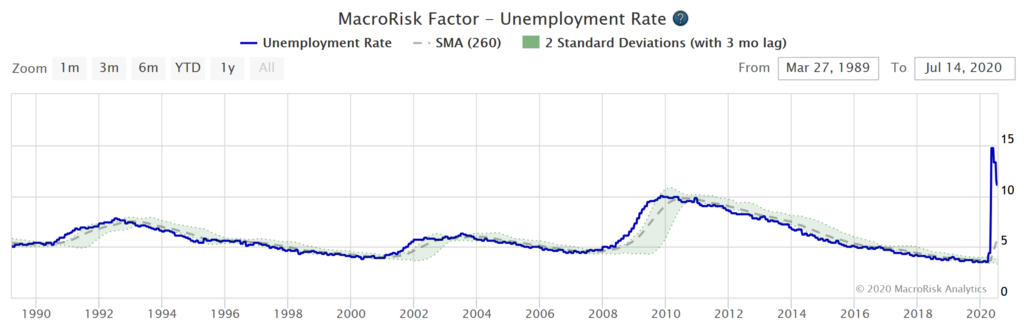
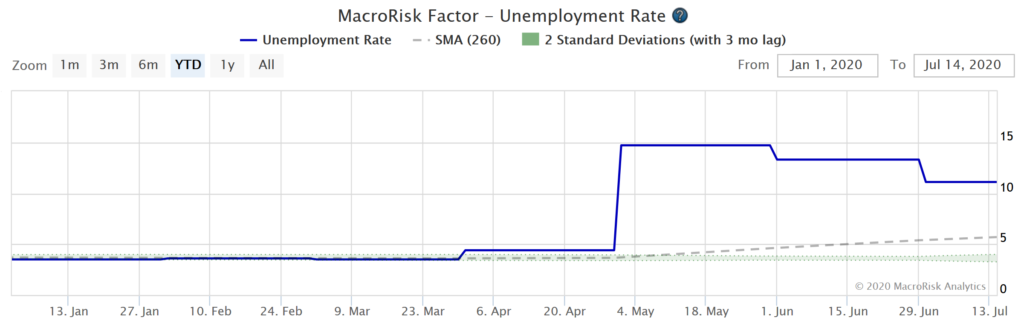
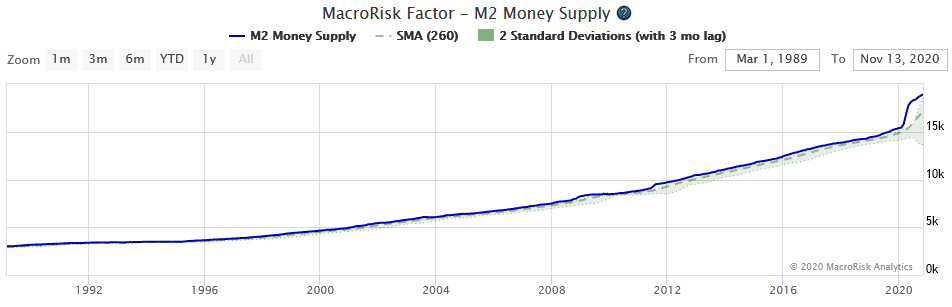
As of November 13, 2020, Tesla stock’s biggest exposure was to M2 money supply. We can see that over time M2 money supply has increased which might be a good driver for the stock price going forward. Here is the graph for M2 money supply since 1989.

Tesla also has high exposures to interest rates: short-, intermediate-, and long-term. It is expected to benefit from a decrease in intermediate-term government bond yields and from an increase in short- and long-term government bond yields.

To summarize, this post has shown Tesla’s sensitivities to 18 MacroRisk factors as illustrated on the MacroRisk Analytics platform. Using this information, investors can identify which economic factors are expected to have the biggest effects on Tesla’s stock price.

At www.MacroRisk.com, you are able to generate Eta profile reports for your portfolios as well as thousands of individual assets and much more. We also provide our “The Economy Matters®” reports on Interactive Brokers, FactSet, Capital IQ, and Refinitiv.

Economic Stats of Pharmaceutical Companies Developing a Covid-19 Vaccine

This post will analyze and compare some pharmaceutical companies developing a vaccine for Covid-19 from an economic perspective using the Eta® statistics on the MacroRisk Analytics® platform. These statistics can assist financial advisors and investors in understanding what economic forces have been driving the stock prices of these companies and how these companies compare in terms of economic risk.

According to a Forbes article dated June 16, 2020, the following five pharmaceutical companies are developing a Covid-19 vaccine:

The table above presents only some of the companies developing a vaccine for Covid-19. (Moderna is another company, for example, that is developing a vaccine but was not analyzed in this post because its stock does not have at least three years of trading history).

These five companies will be compared using the FiveRisks report by MacroRisk Analytics as of November 6, 2020.

Economic Climate Rating

The first statistic that will be analyzed is the economic climate rating. It is a star rating ranging from one to five stars. A rating of one means that the current economy is expected to not be suitable for the asset (i.e., the economy is expected to provide headwind). A rating of three means the economy is expected to be neutral for the asset. A rating of five means that the current economy is expected to be suitable for and benefit the asset (i.e., the economy is expected to provide tailwind). Here are the economic climate ratings for the five companies.

Novavax had the highest economic climate rating of four meaning the economy is expected to be somewhat favorable compared to other companies for which the economy is expected to be neutral.

MacroRisk Level

The second statistic is the MacroRisk Level (MRL) which measures how sensitive an asset is to changes in the economy. The lower the MRL, the lower the asset’s economic risk is expected to be and vice versa. Here are the MRLs for the five companies and also the median, average, minimum and maximum MRLs for the S&P 500 index for comparison.

As can be seen, Novavax stands out withs a very high MRL of 1983. This is higher than the maximum MRL of 930 in the S&P 500 Index as of November 6, 2020 illustrating the high level of economic risk associated with the stock of this company.

Economy’s Influence

The economy’s influence measures how much of the stock price of an asset is driven by changes in the economy rather than company specific information. The higher the value, the more the asset is driven by the economy and vice versa.

Johnson & Johnson as well as Pfizer have low economy’s influence statistics demonstrating that the stock prices of these companies are believed to be driven more by company specific information than what happens in the economy.

Eta® Value at Risk

The Eta Value at Risk statistic measures the expected percent change in the price of an asset, up or down, given an unexpected event that has a five percent probability of happening (whatever this event may be). This is a measure of risk. The lower the statistic, the lower the expected risk of an asset is believed to be and vice versa.

Again, Novavax illustrates high expected risk with the Eta Value at Risk of 48.9%. This means that given an unexpected event with a five percent probability, its stock price is expected to increase or decrease by 48.9%.

Down-market Beta

The down-market beta measures downside risk. It is the expected percent change in the value of an asset when the S&P 500 Index (in this case) drops. If the down-market beta is less than one, the asset is expected to lose less value than the S&P 500 when the S&P 500 drops. If the down-market beta is higher than one, the asset is expected to lose more value than the S&P 500 Index when the index drops. The lower the down-market beta, the less risky an asset is expected to be and vice versa.

In terms of the down-market beta, all of the subject companies except one have lower risk than the average company in the S&P 500. Novavax has somewhat higher risk than the average S&P 500 company with the down-market beta of 1.14 which means that if the S&P 500 Index drops by one percent, the stock price of Novavax is expected to drop by 1.14 percent (i.e., if the S&P 500 drops by 10%, Novavax is expected to drop by 11.4%).

Summary

The goal of this post was to provide some statistics to analyze some of the pharmaceutical companies currently developing a vaccine for Covid-19 from an economic perspective. These statistics show where these companies stand in terms of economic risk in relation to the S&P 500 Index.

The table below will summarize the statistics presented earlier in this post. These statistics are as of November 6, 2020.

The statistics shown in this post can be accessed through the MacroRisk Analytics platform. This platform helps analyze portfolios and thousands of companies, mutual funds, ETFs, etc. with the economy in mind because The Economy Matters®.

Our “The Economy Matters Reports” are also available through Interactive Brokers, FactSet, Capital IQ, and Refinitiv.

5 Nasdaq Stocks with Most and Least Economic Exposure to Oil

The global COVID-19 pandemic and disagreements between Russia and Saudi Arabia caused a one-two punch to the oil prices back in March of 2020. This has created a glut in the oil Market creating disarray amongst OPEC leaders and investors with the futures prices turning negative in April of 2020 for the first time in history. As the economies around the world began to reopen and the OPEC members agreed oil supply cuts, the oil market stabilized with prices continuing to recover.

The MacroRisk Analytics® platform can assist financial advisors in identifying proxy investments, based on economic interactions, that are expected to behave similar to or opposite to oil investments without investing in oil investments themselves (e.g., possibly due to ESG limitations). The proprietary and patented analysis by MacroRisk Analytics allows such an endeavor.

Using the MacroRisk Analytics platform, this post will identify 5 stocks out of the Nasdaq 100 Index that are expected to behave similar to SPDR S&P Oil & Gas Explore & Production ETF (ticker: XOP) and 5 stocks that are expected to behave in an opposite direction.

XOP is an ETF that tracks the performance of oil and gas production and exploration public companies. Using the XOP as a benchmark investment in oil, MacroRisk Analytics can identify potential investments that have similar or different economic exposures to XOP. The Eta® profile, by MacroRisk Analytics, demonstrates these economic exposures. The Eta profile of XOP is shown below:

If a bar is pointing up, the XOP price is expected to increase if that factor increases and vice versa. The magnitudes of the bars also show us the importance of the factors.

To identify our 5 Nasdaq stocks that are expected to behave like XOP, the MacroRisk Analytics platform would look for stocks with similar or opposite Eta profiles to that of XOP. It is very rare to find assets that have the same or opposite Eta profiles exactly but MacroRisk will select investments that are the closest to achieving the specific goal.

Some financial advisors may believe that the oil market would continue its rebound as the economies continue to reopen driving the demand for oil up and the OPEC countries not planning to increase supply. These factors are expected to apply upward pressure to oil prices.

To this end, below are 5 stocks out of the Nasdaq 100 Index that are expected to behave as similar as possible to XOP ETF as of July 19, 2020 using the Eta® tracking error.

On the other hand, other advisors may believe that with the rise of Covid-19 cases in the United States, some states may take steps to slow or implement some economic shutdowns again. This is expected to decrease the demand for oil as economic activity decreases.

To this end, below are 5 stocks out of the Nasdaq 100 Index that are expected to behave as different as possible to XOP ETF as of July 19, 2020 using the Eta® tracking error.

The Investment Ideas Generator by MacroRisk Analytics was used to identify stocks mentioned in this blog post. This tool provides a unique way for financial advisors to find proxy investments out of a buylist (as we just did for oil using Nasdaq 100 stocks) because some advisors may not even be able to take a position in oil-related stocks due to ESG limitations, for example.

Whether you are interested in analyzing oil investments as stand-alone assets or in a portfolio setting and with the economy in mind, MacroRisk Analytics can assist with this as well many other investment analyses. MacroRisk Analytics provides analysis for thousands of stocks, mutual funds, ETFs, and other assets. For sign up, visit http://www.macrorisk.com/subscriptions/.

Some of the MacroRisk Analytics® analysis has been utilized by the Rational Equity Armor Fund (ticker: HDCTX) starting in December of 2019. For more information about the fund, click here.

Mr. Rolland Harris assisted with the preparation of this post.

Unemployment is Significant: A List of NASDAQ Stocks Expected to Benefit from Unemployment Changes

The recent economic shutdown has caused the U.S. unemployment rate to skyrocket making it the most significant economic factor since June of 2020 according to the 18-factor MacroRisk Analytics® model. Financial advisors need to pay special attention to the unemployment rate and understand which stocks are expected to benefit from a decrease or an increase in the unemployment rate and potentially adjust the portfolios of their clients accordingly.

Using the MacroRisk Analytics® platform, this post will present 10 NASDAQ-100 Index stocks that are expected to benefit from a decrease in the unemployment rate and 10 NASDAQ-100 Index stocks that are expected to benefit if the unemployment goes up.

The graph below shows the unemployment rate from 1989 through July 14, 2020, and the Covid-related spike in the unemployment is much greater than the one during the 2008-09 market crash. The green bands around the unemployment rate show the expected unemployment range given its recent movement at the time.

Zooming in to year-to-date unemployment rate, we can see just how much above the unemployment rate is compared to the upper bound of the green bands which correspond to the expected range of the unemployment rate based on its recent history (the green bands correspond to two standard deviations around the moving average).

Looking at the MacroRisk’s snapshot below of where the economic factors stand relative to their recent history as of 7/14/2020 clearly shows that the unemployment rate exhibits the most volatility relative to its moving average. The graph below shows how many standard deviations away a factor is from its moving-average. Red factors, such as the unemployment rate, are outside the two standard-deviation range denoted by the dashed lines.

With the unemployment rate factor being so significant in mind, using the MacroRisk Analytics® platform, we present a list of NASDAQ-100 Index stocks that are expected to benefit from a decrease in the unemployment rate and vice versa. These stocks are expected to have the biggest portion of their economic risk correspond to unemployment and where the stocks’ sensitivities to unemployment are negative as denoted by negative signs in the table below (i.e., expected to benefit from a decrease in the unemployment rate).

NameSymbolUnemployment as a Proportion of Economic Risk as of 7/14/2020
Amgen IncAMGN-5.1%
Gilead Sciences IncGILD-4.5%
Walgreens Boots Alliance IncWBA-4.4%
Vertex Pharmaceuticals IncVRTX-3.3%
Intuitive Surgical IncISRG-3.2%
Regeneron Pharmaceuticals IncREGN-3.1%
Biogen IncBIIB-3.0%
Incyte CorpINCY-2.6%
Lam Research CorpLRCX-2.5%
PACCAR IncPCAR-2.2%

Below is a list of 10 NASDAQ-100 Index stocks that are expected to benefit from an increase in the unemployment rate (i.e., these stocks are expected to have the highest positive sensitivity to the unemployment rate as a percentage of their economic risk).

NameSymbolUnemployment as a Proportion of Economic Risk as of 7/14/2020
Facebook IncFB8.4%
eBay IncEBAY5.1%
CoStar Group IncCSGP4.9%
Copart IncCPRT4.7%
Cintas CorpCTAS4.4%
Liberty Global plcLBTYK4.3%
NXP Semiconductors N.V.NXPI4.1%
Adobe Systems IncADBE4.0%
Liberty Global plc cl ALBTYA3.9%
PayPal Holdings IncPYPL3.5%

With the economy opening up, more and more people are expected to return to work which would drive the unemployment down. However, there exists a risk of a second wave of COVID-19 infections which might cause the unemployment to increase if similar shutdown measures are implemented.

You can find the economic exposures (such as the unemployment rate discussed in this post) of thousands of stocks, mutual funds, ETFs, and other assets using The Economy Matters® reports provided by MacroRisk Analytics®.

Some of the MacroRisk Analytics® analysis has been utilized by the Rational Equity Armor Fund (ticker: HDCTX) starting in December of 2019. For more information about the fund, click here.

Mr. Rolland Harris assisted with the preparation of this post.

When so many stocks are down, which are undervalued? MacroRisk’s Relative Value Index can help.

The COVID-19 virus continues to spread around the world and seems to have “infected” investors with fear and panic. The market’s volatility has spiked, and major indexes around the world have dropped from their recent highs. In times like these, panic and emotion seem to drive the market swings rather than the underlying economic conditions. Some financial advisors and investors might be trying to take money off the table before they lose more while others jump at this opportunity to purchase assets at fire-sale prices.

To assist financial advisors and investors with investment analysis, we will provide a list of 20 NASDAQ stocks with high market cap and estimate how overvalued or undervalued these stocks are using the Relative Value statistic provided by the MacroRisk Analytics® platform because a reasonable question always arises: is what I plan to purchase undervalued, overvalued, or fairly valued? While typical  analytics products emphasize accounting analysis or technical ratios to determine price valuation, the MacroRisk Analytics platform provides “a better window on the future”®.  Its patented and proprietary tools can help investors take emotions out of the investment decision-making process and focus on how the underlying economic values of their investments, including most stocks and funds traded in the U.S. and Canada.  Of particular note is the “relative value statistic” which presents the extent to which an asset is under- or over-valued; this statistic compares the Eta® price (i.e., MacroRisk’s statistical estimate of an asset’s intrinsic price) to the corresponding market price of the asset.

MacroRisk’s Eta® price estimate is computed using advanced data analysis and considers the specific impacts of these 18 macroeconomic variables:

  1. Short-term government bond yield
  2. Intermediate-term government bond yield
  3. Long-term government bond yield
  4. Corporate bond (BAA) yield
  5. Unemployment rate
  6. Corporate cash flow
  7. Housing starts
  8. Auto sales
  9. New durable goods
  10. Gold index
  11. Energy prices
  12. CPI (inflation)
  13. Monetary base
  14. M2 Money
  15. Euro exchange rate
  16. FTSE 100
  17. Tokyo stock exchange
  18. Agricultural exports

Similar to how factors such as the number of bedrooms, number of baths, square footage, etc. determine the price  of a house, these 18 macroeconomic variables determine the intrinsic value estimate, the Eta® price of an asset.

The relative value statistic is interpreted as follows:

Relative Value by MacroRisk Analytics Valuation Expectation
<1 Expected to be overvalued
1 Expected to be fairly valued
>1 Expected to be undervalued

To illustrate the relative value score, consider the following list of 20 large cap NASDAQ stocks and their corresponding relative value statistics as of 3/16/2020:

Name Symbol Relative Value as of 3/16/2020
CME Group Inc CME 1.361
Exelon Corp EXC 1.306
CSX Corp CSX 1.202
The Kraft Heinz Co KHC 1.161
Automatic Data Processing Inc ADP 1.131
Pepsico Inc PEP 1.128
Mondelez International Inc MDLZ 1.108
Microsoft Corp MSFT 1.102
Intel Corp INTC 1.099
Starbucks Corp SBUX 1.082
Apple Inc AAPL 1.078
Nvidia Corp NVDA 1.057
Intuit Inc INTU 1.043
Analog Devices Inc ADI 1.034
Equinix Inc EQIX 1.027
Qualcomm Inc QCOM 1.016
Comcast Corp CMCSA 0.962
Texas Instruments Inc TXN 0.949
Cisco Systems Inc CSCO 0.948
Marriott International MAR 0.943

According to the current economic conditions, even with all the current social volatility disrupting markets, 16 out of these 20 stocks presented seem to be potential buy targets because their relative value statistics are over 1; their market prices are substantially below MacroRisk’s statistically based  intrinsic values estimates.

During turbulent times that we are currently experiencing, it is ever more important to keep emotions in check while investing. The relative value tool statistic allows investors to take a step back from the speculation going on in the world and focus on whether an asset is expected to be under- or over-valued based on the current economy. The relative value information presented for 20 NASDAQ stocks above uses the underlying economic conditions expected to drive the values of assets over the long-term.

When you are considering changing your holdings, whether in a crisis or not, the Relative Value Index can help pinpoint undervalued opportunities.

www.MacroRisk.com provides relative value and other statistics as well as a selection of patented and  proprietary analysis tools for tens of thousands of stocks, mutual funds, ETFs, and other traded assets. The Relative Value Score for stocks and funds is also included in “The Economy Matters” reports available from numerous platforms.  Click here to see how MacroRisk Analytics can help you. 

Mr. Rolland Harris assisted with the preparation of this post.

The Economic Climate is Stormy for Most NASDAQ Stocks

The market is getting whipsawed by negative news regarding the coronavirus and potential profit and supply chain disruptions, at the same time unemployment rates and interest rates are at record lows.  While the focus is largely on the public health disruptions, eventually the market will again focus on the economy and its impact on profits and growth.  Research by MacroRisk has shown that different companies have different responses to economic variables, and that the same set of economic conditions might be favorable for some companies and unfavorable for others.  The most valuable, and seemingly the most turbulent, stocks appear to be those on the NASDAQ.  In this report, we ask what the economic climate might be for NASDAQ stocks when the social angst calms down and investors care about profits, costs, and more mundane economic factors of investing.

Using the patented and proprietary tools available on the MacroRisk Analytics® platform, we will show the distribution of NASDAQ stocks that are currently expected to be suitable in the current economy to those stocks that are not. This can help investors and financial advisors understand what portion of stocks is expected to benefit from current economic conditions and which portion is not. It will help to answer the following question: what portion of stocks does the economy provide tailwind for, headwind for or is neutral for? This, in turn, can assist in understanding where the overall economy currently stands.

To demonstrate this, we use MacroRisk’s “economic climate rating (ECR)” based on its patented technology. This powerful rating measures the expected impact of the current economic climate for individual assets (including stocks, funds, and many others) over the next six to 12 months.  The ECR is a five-star scale where one indicates substantial economic storms in the forecast and five indicates positive tailwinds and a favorable climate.

As of 3/9/2020, the average economic climate rating is 2.2 for covered NASDAQ stocks (those with at least three years of trading history). Overall, the forecasted economic climate is somewhat unfavorable for NASDAQ stocks.  On the other hand, there are some NASDAQ stocks which seem to have their corporate sales perfectly trimmed to catch the economic breezes, and they receive a 5-star rating.

The distribution of the economic climate rating is presented in the following graph.  The graph below shows that there are more of 1- and 2-star stocks than 4- and 5-star stocks as of 3/9/2020.

The economic climate rating is based on each stock’s unique response to key 18 economic factors in conjunction with the current values of those factors.  The graph below shows the current economy expressed as “z scores”, that is in a way that adjusts for different magnitudes and different volatilities.  In the chart below, each bar shows the current economic value compared to its historical values.  The economic climate rating is computed using the current values and doesn’t include additional economic forecasting.

Given that there are more stocks for which the current economy is expected to not be suitable than those for which it is, investors might consider a more defensive approach to their portfolios. This analysis assumes that the economic factors will continue in their current directions. Alternatively, investors may choose to focus on those where the economy is most favorable.

The next table shows the top 10 NASDAQ stocks in terms of their economic climate as of 3/9/2020. In other words, these are the 10 stocks that are believed to be most undervalued according to the 18 macroeconomic factor MacroRisk model.

MacroRisk Analytics® research is available on Interactive Brokers through our “The Economy Matters®” reports.

MacroRisk Analytics also has a selection of proprietary analysis tools, including the economic climate rating discussed in this post, that use macroeconomic variables to provide information on tens of thousands of stocks, mutual funds, exchange traded funds, and other traded assets. Click here to see how MacroRisk Analytics can help you. 

An Alternative Perspective on Economic Risk: How Economic Shocks Impact Twenty S&P 500 Stocks

Some common rules-of-thumb are that cyclical companies tend to be riskier because their returns swing higher or lower than those of non-cyclical companies and that the consumer staples sector tends to be less risky than the consumer discretionary sector. Such generalizations oversimplify the investment analysis of how economic shocks impact companies because, frankly, more detailed analysis can be hard and confusing.  But, investors face complications, losses, and leaving money on the table,  if economic risks aren’t better understood.  Now, using the patented and proprietary tools available on the MacroRisk Analytics platform, we can measure the overall sensitivity to the economy found in individual assets and better understand which stocks are most, and least, sensitive to economic shocks.

For this analysis, we define economic risk exposure as an asset’s sensitivity to changes in the economy. The more sensitive a stock, mutual fund, or a portfolio is to changes in key economic variables, the more economic risk it has and vice versa.  On its www.MacroRisk.com website, MacroRisk Analytics® calculates its MacroRisk Level, an aggregated measure across economic factors of each asset’s sensitivity to the economy.

We measure “the economy” using 18 macroeconomic variables that the MacroRisk data analytics team identified as a robust set of factors that does a good job of explaining the movement of asset values over time. These 18 factors include interest rates, international variables, various price index levels, monetary variables, and domestic production variables. (The patented MacroRisk approach has been analyzed in multiple academic papers, with two papers winning the William F. Sharpe Indexing Achievement Award for the ETF/Indexing Paper of the Year in 2013 and 2015.) The MacroRisk Level provides an aggregate statistic across all 18 macroeconomic factors for seasoned companies, those with at least three years of trading history.

The 10 seasoned companies in the S&P 500 Index with the most amount of economic risk as of 2/10/2020 are:

Rank Name Symbol Sector MacroRisk Level
1 Advanced Micro Devices Inc AMD Information Technology 644
2 Xilinx Inc XLNX Information Technology 640
3 Hollyfrontier Corp HFC Energy 571
4 Ulta Beauty Inc ULTA Consumer Discretionary 484
5 ABIOMED Inc ABMD Health Care 483
6 Paycom Software Inc PAYC Information Technology 480
7 Twitter Inc TWTR Communication 472
8 Macy’s Inc M Consumer Discretionary 429
9 Centurylink Inc CTL Communication 414
10 Coty Inc COTY Consumer Staples 413

According to the common wisdom, one could have labeled Coty Inc. as a relatively less risky stock just because it’s in the consumer staples sector. However, taking a deeper look and understanding the economic risk exposure measured for this stock shows that it might not be such a safe company after all.

And, the 10 seasoned companies in the S&P 500 Index with the least amount of economic risk as of 2/10/2020 are:

Rank Name Symbol Sector MacroRisk Level
1 Host Hotels & Resorts Inc HST Real Estate 34
2 Nucor Corp NUE Materials 62
3 Maxim Integrated Products Inc MXIM Information Technology 64
4 Fidelity National Information Services FIS Information Technology 65
5 Digital Realty Trust Inc DLR Real Estate 67
6 Loews Corp L Financials 68
7 FirstEnergy Corp FE Utilities 69
8 Blackrock Inc BLK Financials 70
9 Interpublic Group of Companies Inc (The) IPG Communication 70
10 Westar Energy Inc EVRG Utilities 71

Similarly, just because Fidelity National Information Services is in the information technology sector does not make it a relatively riskier stock in terms of its low MacroRisk Level, or economic risk, of 65.

The MacroRisk Level is based on 18 individual factors and there may be value drilling down to see which economic variables are driving the MacroRisk Level.  Using AMD, which had an estimate of 644 on  2/10/2020, we see that it is most sensitive to intermediate and long term bond yields and the M2 money supply (which reflects consumer credit).

The graph above shows the economic risks which are used in the calculation of the MacroRisk Level. The larger the bars, either positive or negative, the riskier the company is expected to be. Notice the y-axis scale which runs from -200 to 200.

Now, consider the specific economic sensitivities of Host Hotels & Resorts Inc., with a MacroRisk Level of 34 as of 2/10/2020.  Notice that for Host the chart runs from -10 to 10.

Comparing the two on the same graph emphasizes how much riskier AMD is than Host with respect to economic factors.

For context, the AMD estimated beta is 2.29 and the HST estimated beta is 0.95.  AMD is more sensitive to market changes than is HST, but even though the beta statistic is twice HST, it understates the potential swings in AMD value relative to safer investments when there are economic shocks (e.g., 644 vs 34 MacroRisk Level).

MacroRisk Analytics® research is available on Interactive Brokers through our “The Economy Matters®” reports.

MacroRisk Analytics also has a selection of proprietary analysis tools that use macroeconomic variables to provide information on tens of thousands of stocks, mutual funds, exchange traded funds, and other traded assets. Click here to see how MacroRisk Analytics can help you. 

Trade War Update: Ag Exports Are Up. What Stocks Are Impacted?

In the trade war, China targeted the U.S. farmers, who represent a sizeable voter base for President Trump, with its own tariffs on American farm products including soybeans, corn, cotton, and more.  Now, the war is winding down, and U.S. ag exports are up. It’s time to start counting the winners and losers.

Not all impacted companies are traditional agribusiness or export companies. In this report, we’ll summarize how the trade war is impacting agricultural exports and then use the MacroRisk Analytics platform to find a list of stocks that you might not have anticipated would have positive (or negative) responses to the growth in U.S. agricultural exports.

According to MarketWatch, “President Donald Trump said Sunday [October 13, 2019] that China has begun purchasing U.S. agricultural products, just two days after the two countries reached a tentative pause in their trade war” on October 11, 2019. In its article, the American Farm Bureau Federation confirms this by stating that “from January through November 2019, U.S. ag exports to China totaled $12.3 billion, compared to $8.7 billion during the same period in 2018. The year-to-date export value in 2019 is significantly higher than the previous year because of increased purchases that began in June [of 2019]. Then, on January 15, 2020, the “Phase One” trade deal was signed between the U.S. and China with China committing “to buying an additional $200 billion worth of American goods, including agricultural products and cars, over two years” (source). 

It looks like times are better for U.S. farmers, and this is shown in the “economy status” chart published on MacroRisk.com. This graph shows the current economy as expressed by 18 key macroeconomic factors, including U.S. agricultural exports.  The chart shows a “z-score” relative to a historical average and the bars in red are those which are more than two standard deviations away from their historical values.

The MacroRisk.com economic status as of 2/5/2020 shows that ag exports are one of five economic variables currently above their historical values. (The others are the Tokyo Stock Exchange index, the M2 Money Supply, Corporate Cash Flows, and Housing Starts.)

While ag exports are high compared to their recent history, the exports still have quite a ways to go to meet the levels achieved during the previous administration. 

Below are the 10 stocks out of the S&P 500 Index that have the largest, positive exposure to the agricultural exports as a proportion of their economic risk as of 2/5/2020.   These may be companies to evaluate if ag exports continue growing.

Name Symbol Sector Proportion of Ag Exports sensitivity to economic risk as of 2/5/2020
MGM Resorts International MGM Consumer Discretionary 5.46%
Pultegroup Inc PHM Consumer Discretionary 5.37%
NVR Inc NVR Consumer Discretionary 5.07%
Blackrock Inc BLK Financials 4.92%
Intel Corp INTC Information Technology 4.66%
Lennar Corp LEN Consumer Discretionary 4.56%
BorgWarner Inc BWA Consumer Discretionary 4.10%
Las Vegas Sands Corp LVS Consumer Discretionary 3.99%
CBRE Group Inc Common Stock Class A CBRE Real Estate 3.92%
Freeport-McMoran Inc FCX Materials 3.53%

And shown below are the 10 stock out of the S&P 500 with the largest, negative exposure to agricultural exports as a proportion of their economic risk as of 2/5/2020.  These are stocks that might be examined because of a possibility of underperformance as ag exports continue expanding.

Name Symbol Sector Proportion of Ag Exports sensitivity to economic risk as of 2/5/2020
Expedia Group Inc EXPE Consumer Discretionary -7.55%
Baxter International Inc BAX Health Care -5.89%
Digital Realty Trust Inc DLR Real Estate -5.81%
Medtronic PLC MDT Health Care -5.18%
Hasbro Inc HAS Consumer Discretionary -5.10%
IDEXX Laboratories Inc IDXX Health Care -5.06%
Gilead Sciences Inc GILD Health Care -4.31%
Take-Two Interactive Software Inc TTWO Communication -4.22%
Activision Blizzard Inc ATVI Communication -3.83%
Jack Henry & Associates Inc JKHY Information Technology -3.64%

“Ag exports”  is just one of 18 economic variables that are used by MacroRisk.com to estimate current intrinsic value and numerous specific risk measures for almost every major traded stock, fund, and ETF on the U.S. and Canadian exchanges.  As the economy changes, different stocks may have unexpected responses but MacroRisk’s “The Economy Matters” reports and its “Investment Tools for the Changing Economy”® can help you prepare for the unexpected.